 EMODnet Product Catalogue
Leibniz Institute for Baltic Sea Research Warnemunde
Type of resources
Available actions
Topics
Keywords
Contact for the resource
Provided by
Years
Formats
Representation types
Scale 1:
-
The dataset provides full-coverage maps of the habitats and biotopes in the German Baltic Sea at a resolution of 1 x 1 km for the entire region and at 50 x 50 m resolution in specific areas. We combined geological and biological surveys to map the seabed and collected extensive data to classify different habitats and their associated benthic communities. Using newly established national guidelines and predictive habitat modelling, we produced highly accurate maps. For upload to EMODnet four separate maps were made: - Broad Habitat Types according to the Marine Strategy Framework Directive (MSFD). - Annex I Habitat types - Habitat types classified according to the Baltic Sea-wide HELCOM underwater biotope and habitat classification (HUB) - other habitat types, OHTs for German marine waters include biotope types according to S30 of the German Federal Nature Conservation Act (BNatSchG), according to the European Habitats Directive (92/43/EEC), as well as the Baltic Sea-wide HELCOM Red List types
-
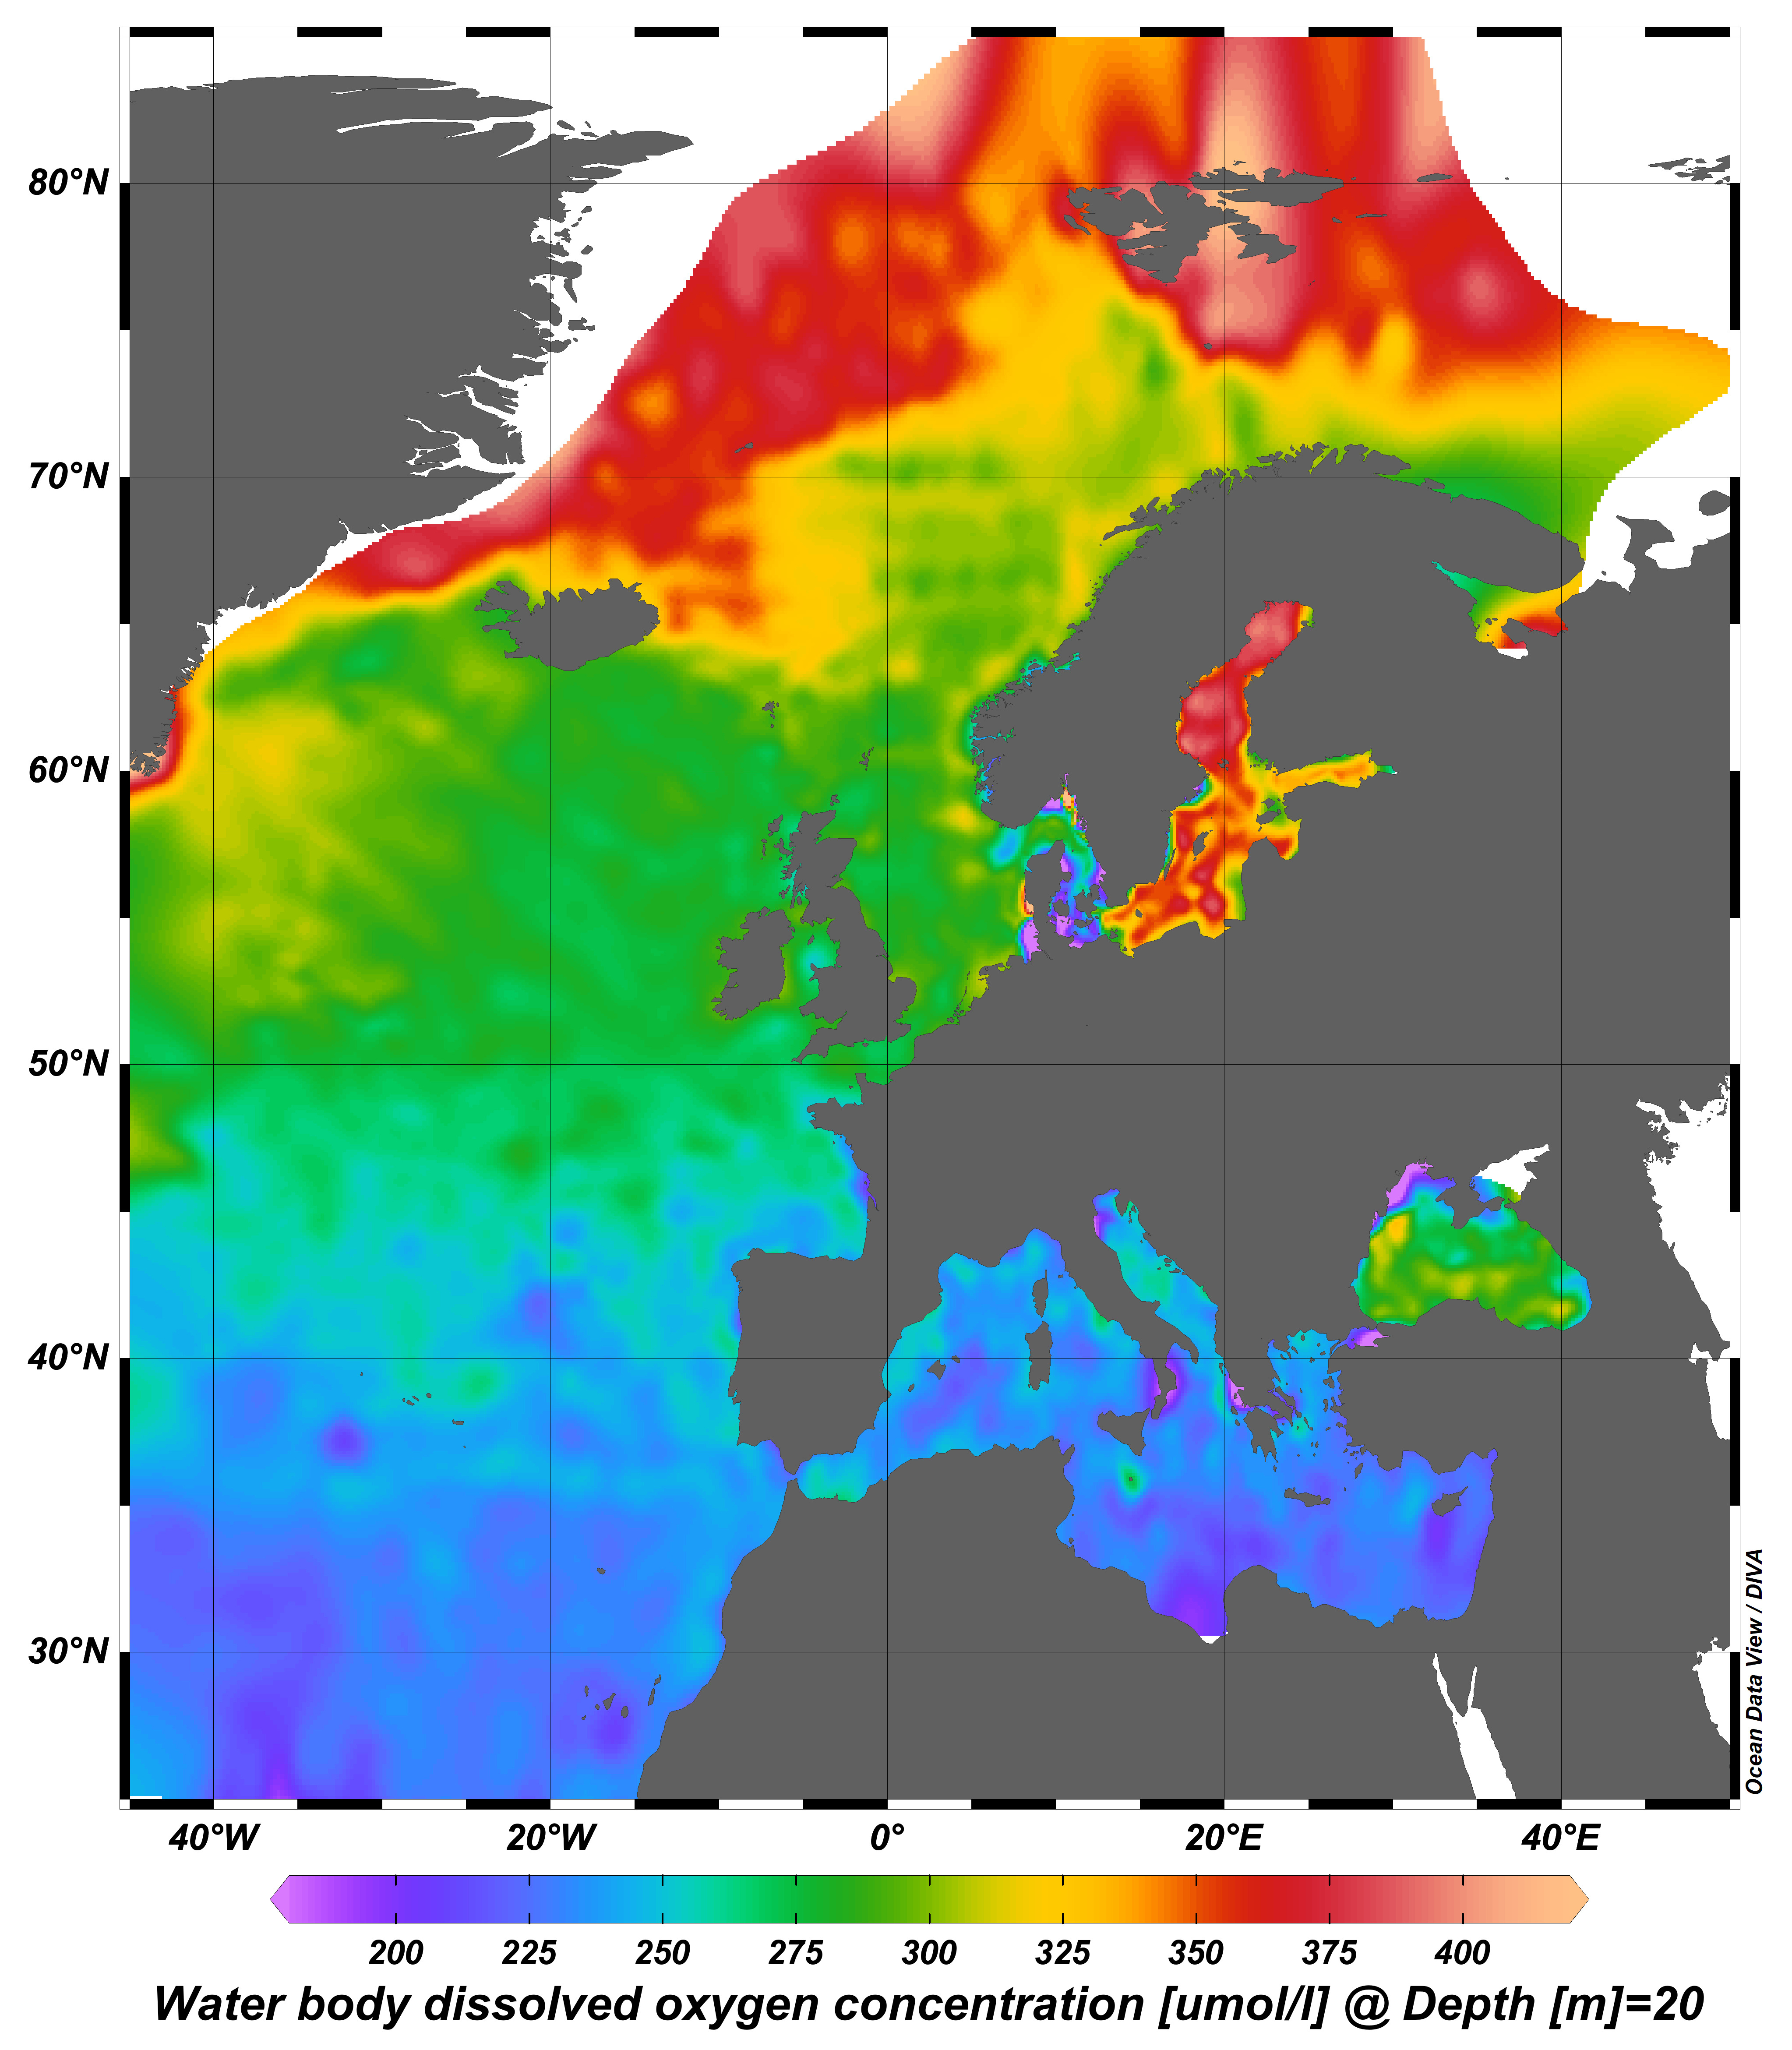
webODV visualisations via WMS from the harmonized, standardized, validated data collections that EMODnet Chemistry is regularly producing and publishing for all European sea basins for eutrophication and contaminants. You can analyze, visualize, subset and download EMODnet Chemistry data using interactive webODV services. More information at: https://emodnet.ec.europa.eu/en/chemistry#chemistry-services
-
This product displays for Triphenyltin, positions with values counts that have been measured per matrix and are present in EMODnet validated datasets. The product displays positions for all available years and per year.
-
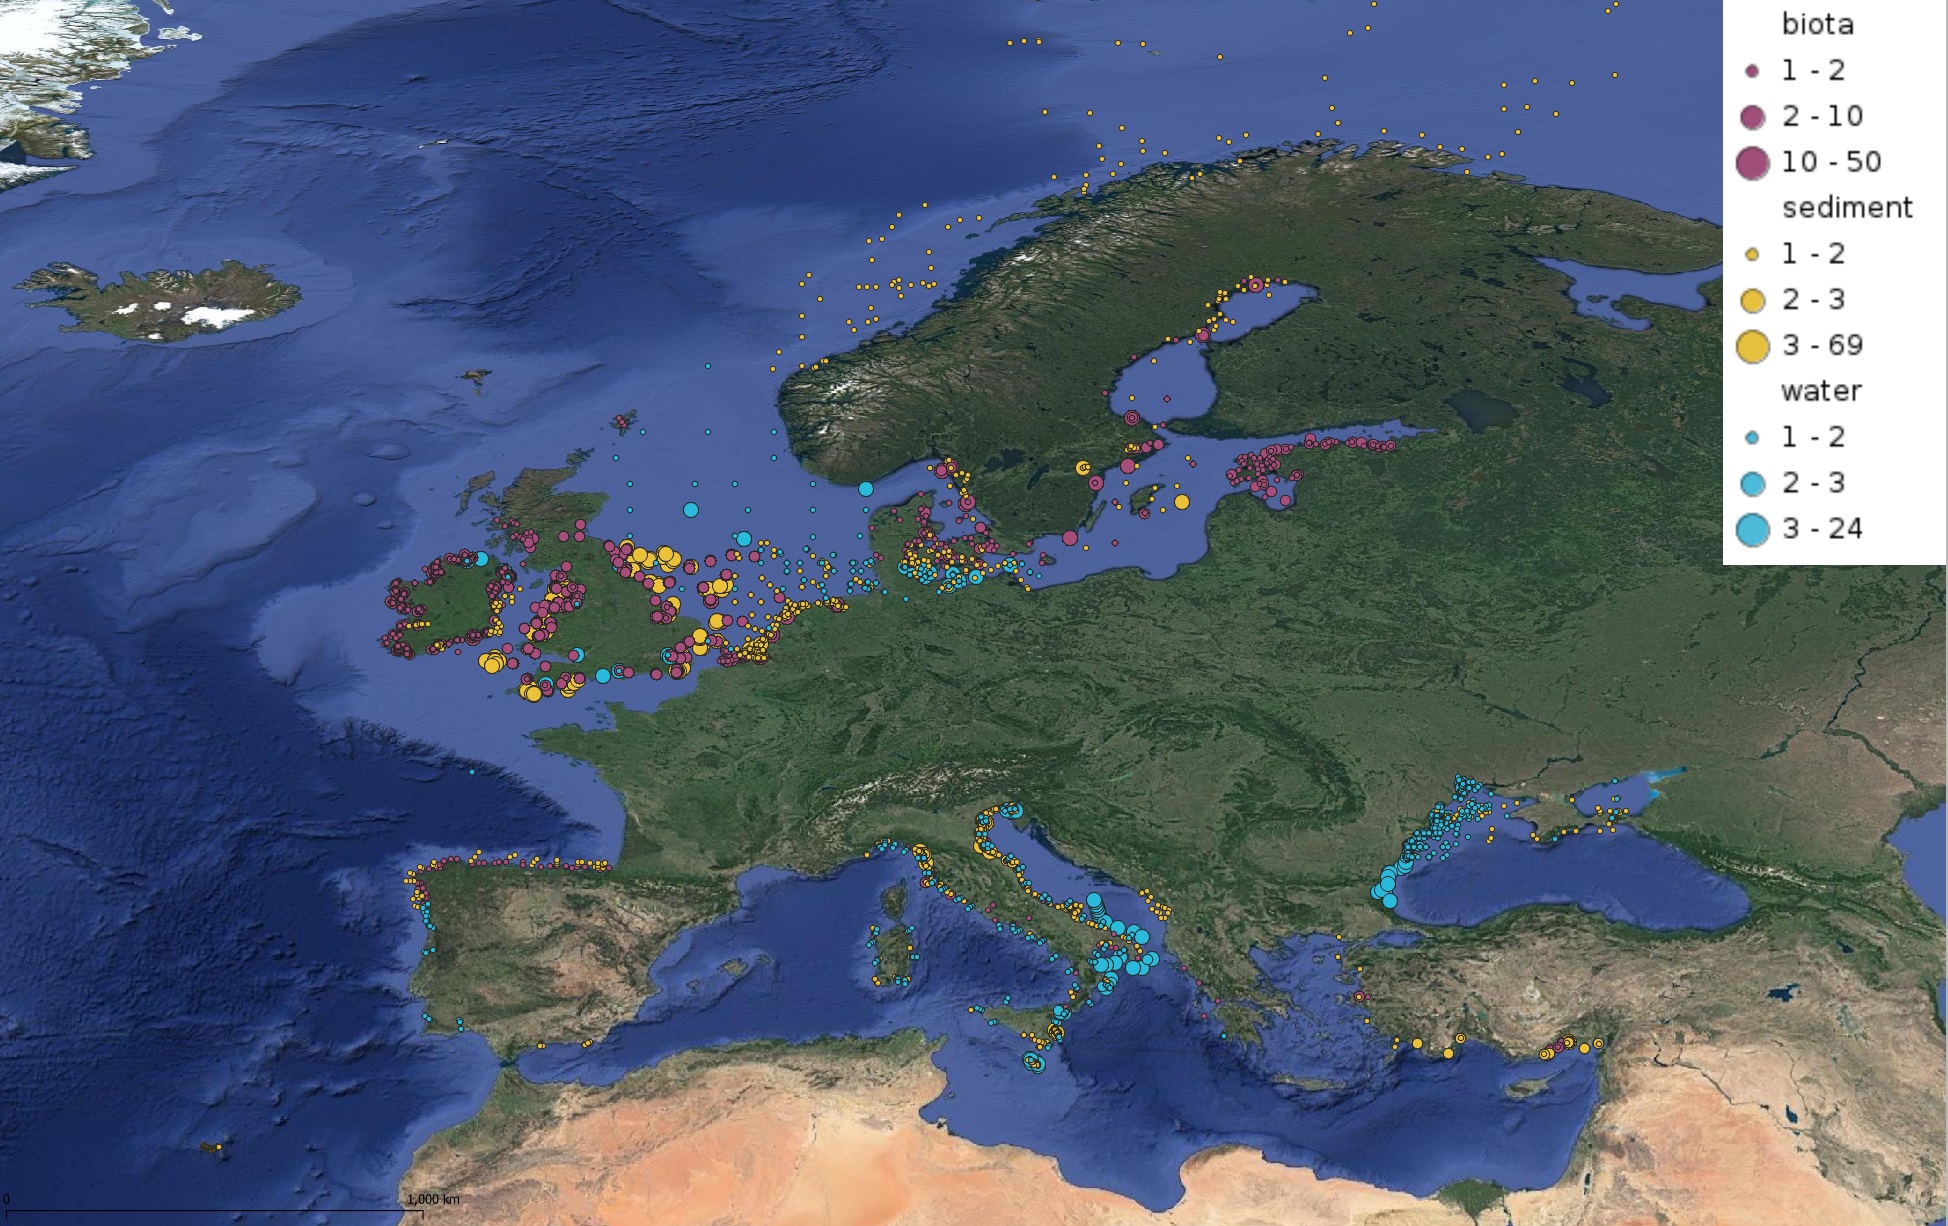
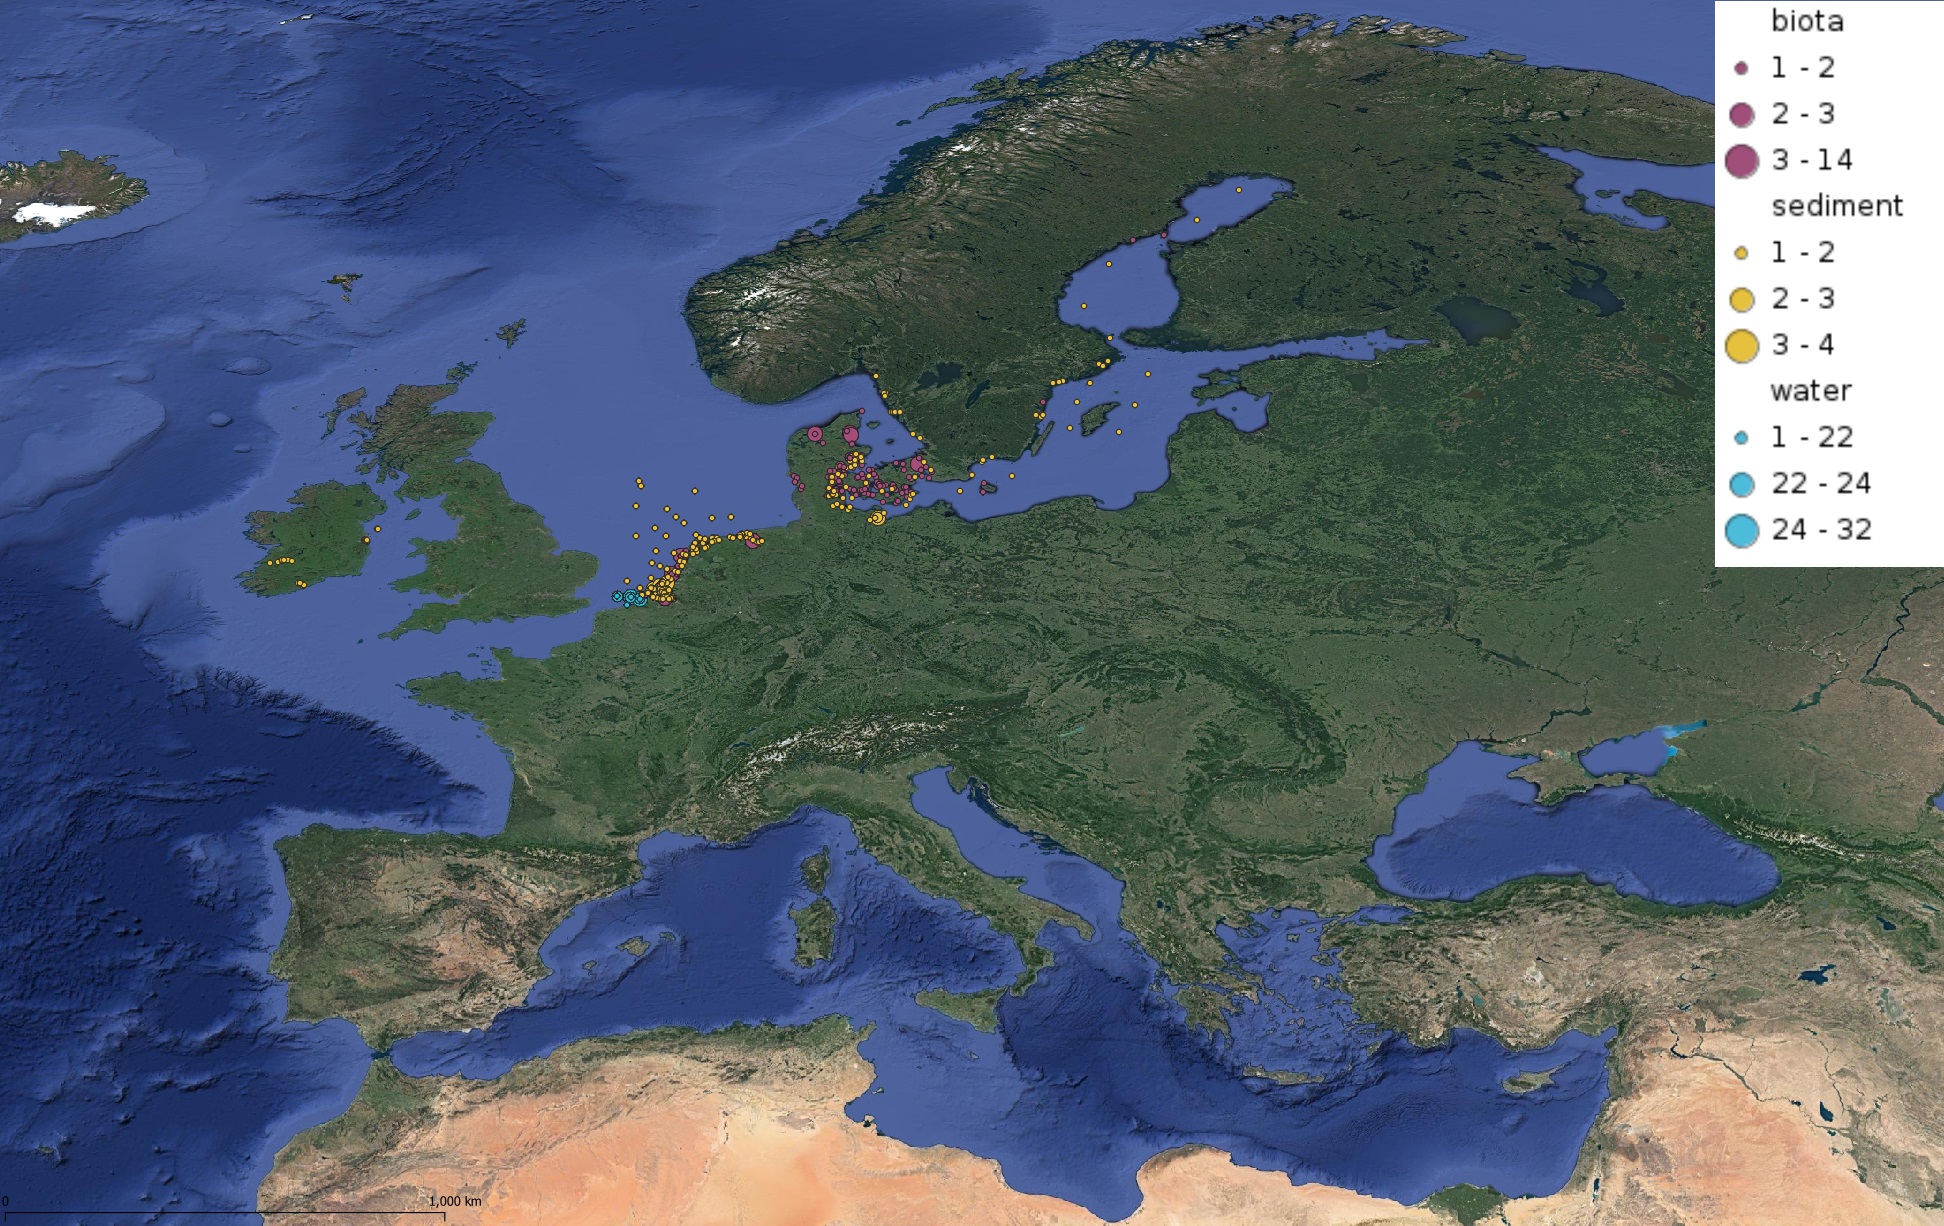
This product displays for Hexachlorobenzene, positions with values counts that have been measured per matrix and are present in EMODnet validated datasets. The product displays positions for all available years and per year.
-
This product displays for Nickel, median values of the last 6 available years that have been measured per matrix and are present in EMODnet validated datasets. The median values ranges are derived from the following percentiles: 0-25%, 25-75%, 75-90%, >90%. Only "good data" are used, namely data with Quality Flag=1, 2, 6, Q (SeaDataNet Quality Flag schema). For water, only surface values are used (0-15 m), for sediment and biota data at all depths are used.
-
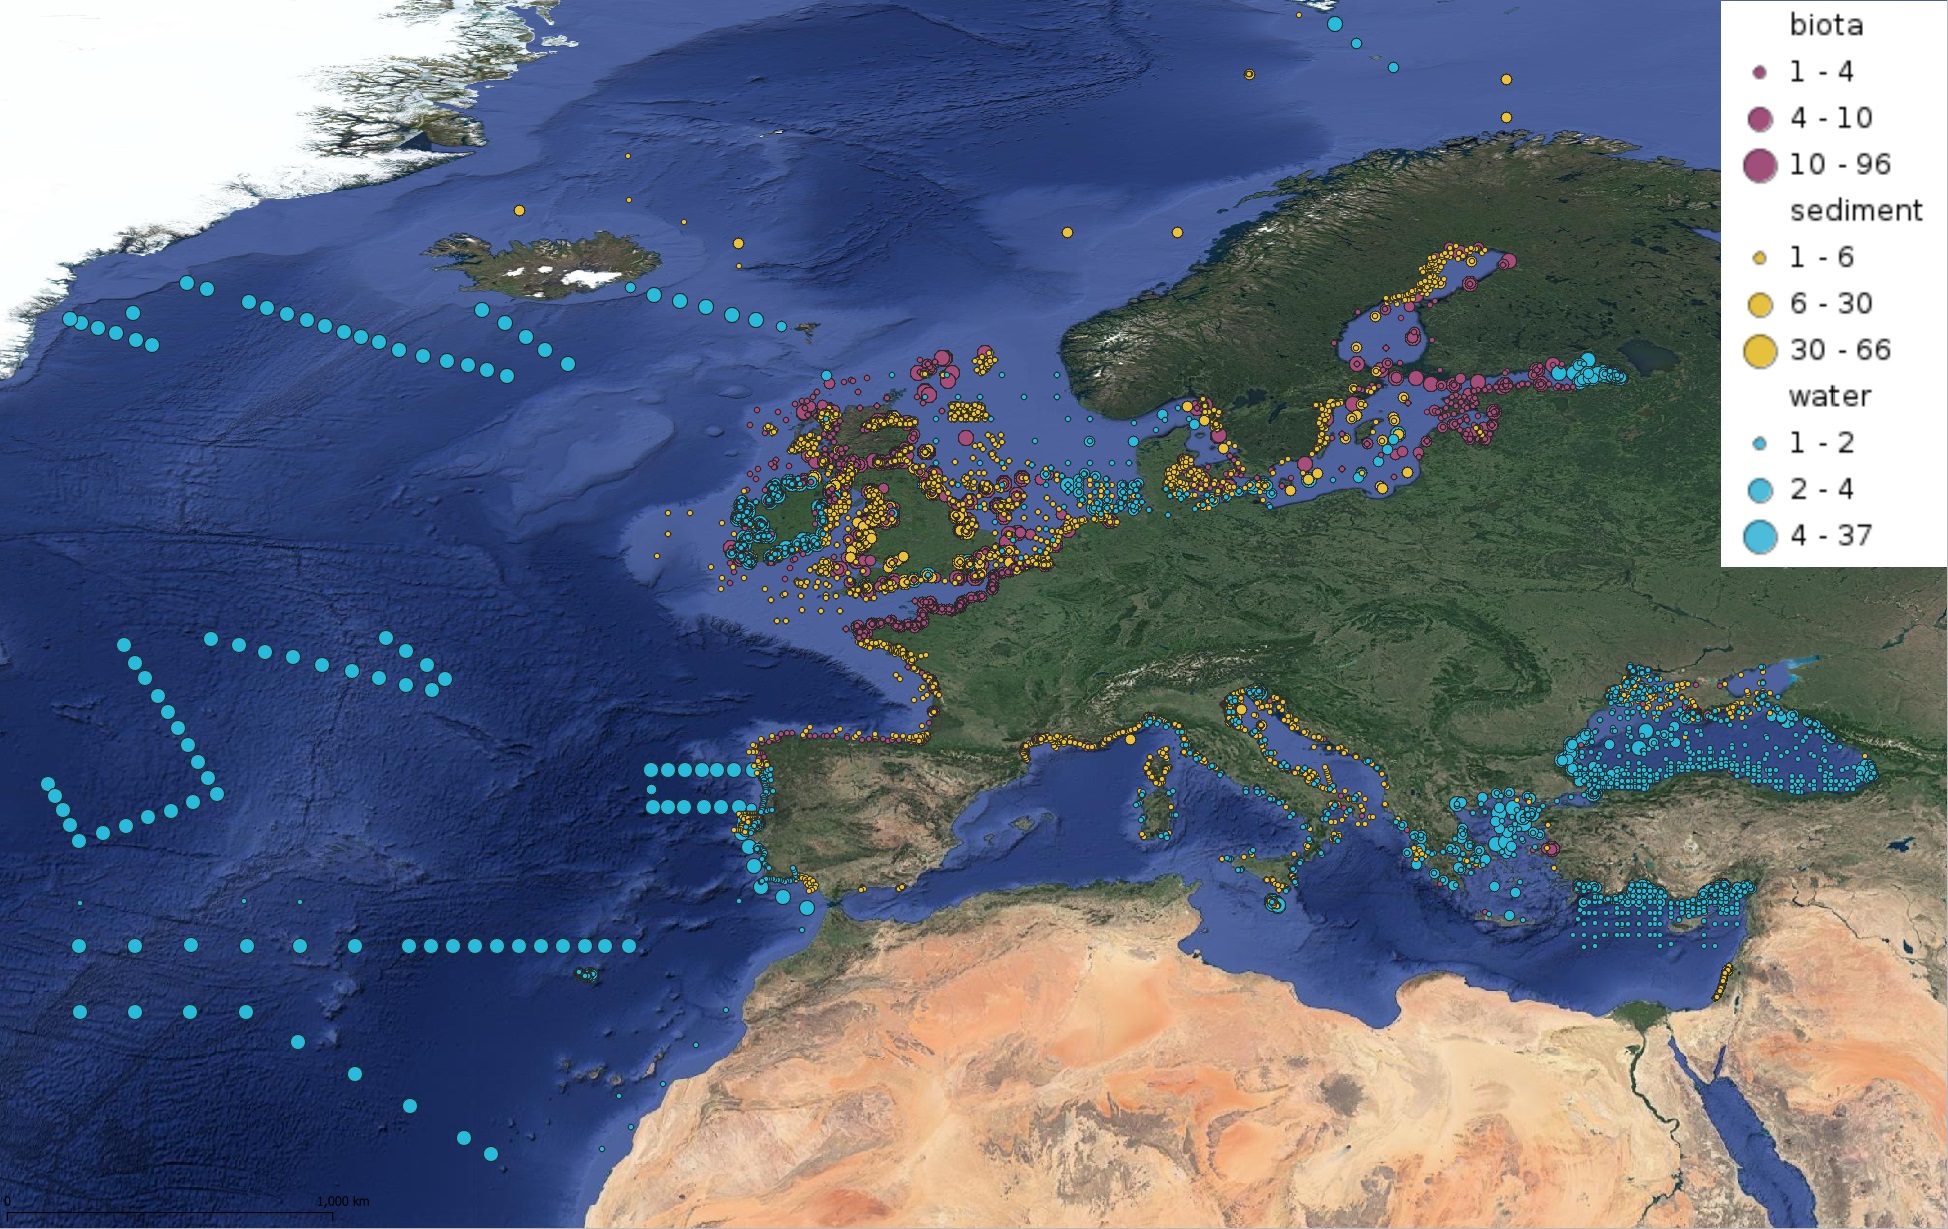
This product displays for Mercury, positions with values counts that have been measured per matrix and are present in EMODnet validated datasets. The product displays positions for all available years and per year.
-
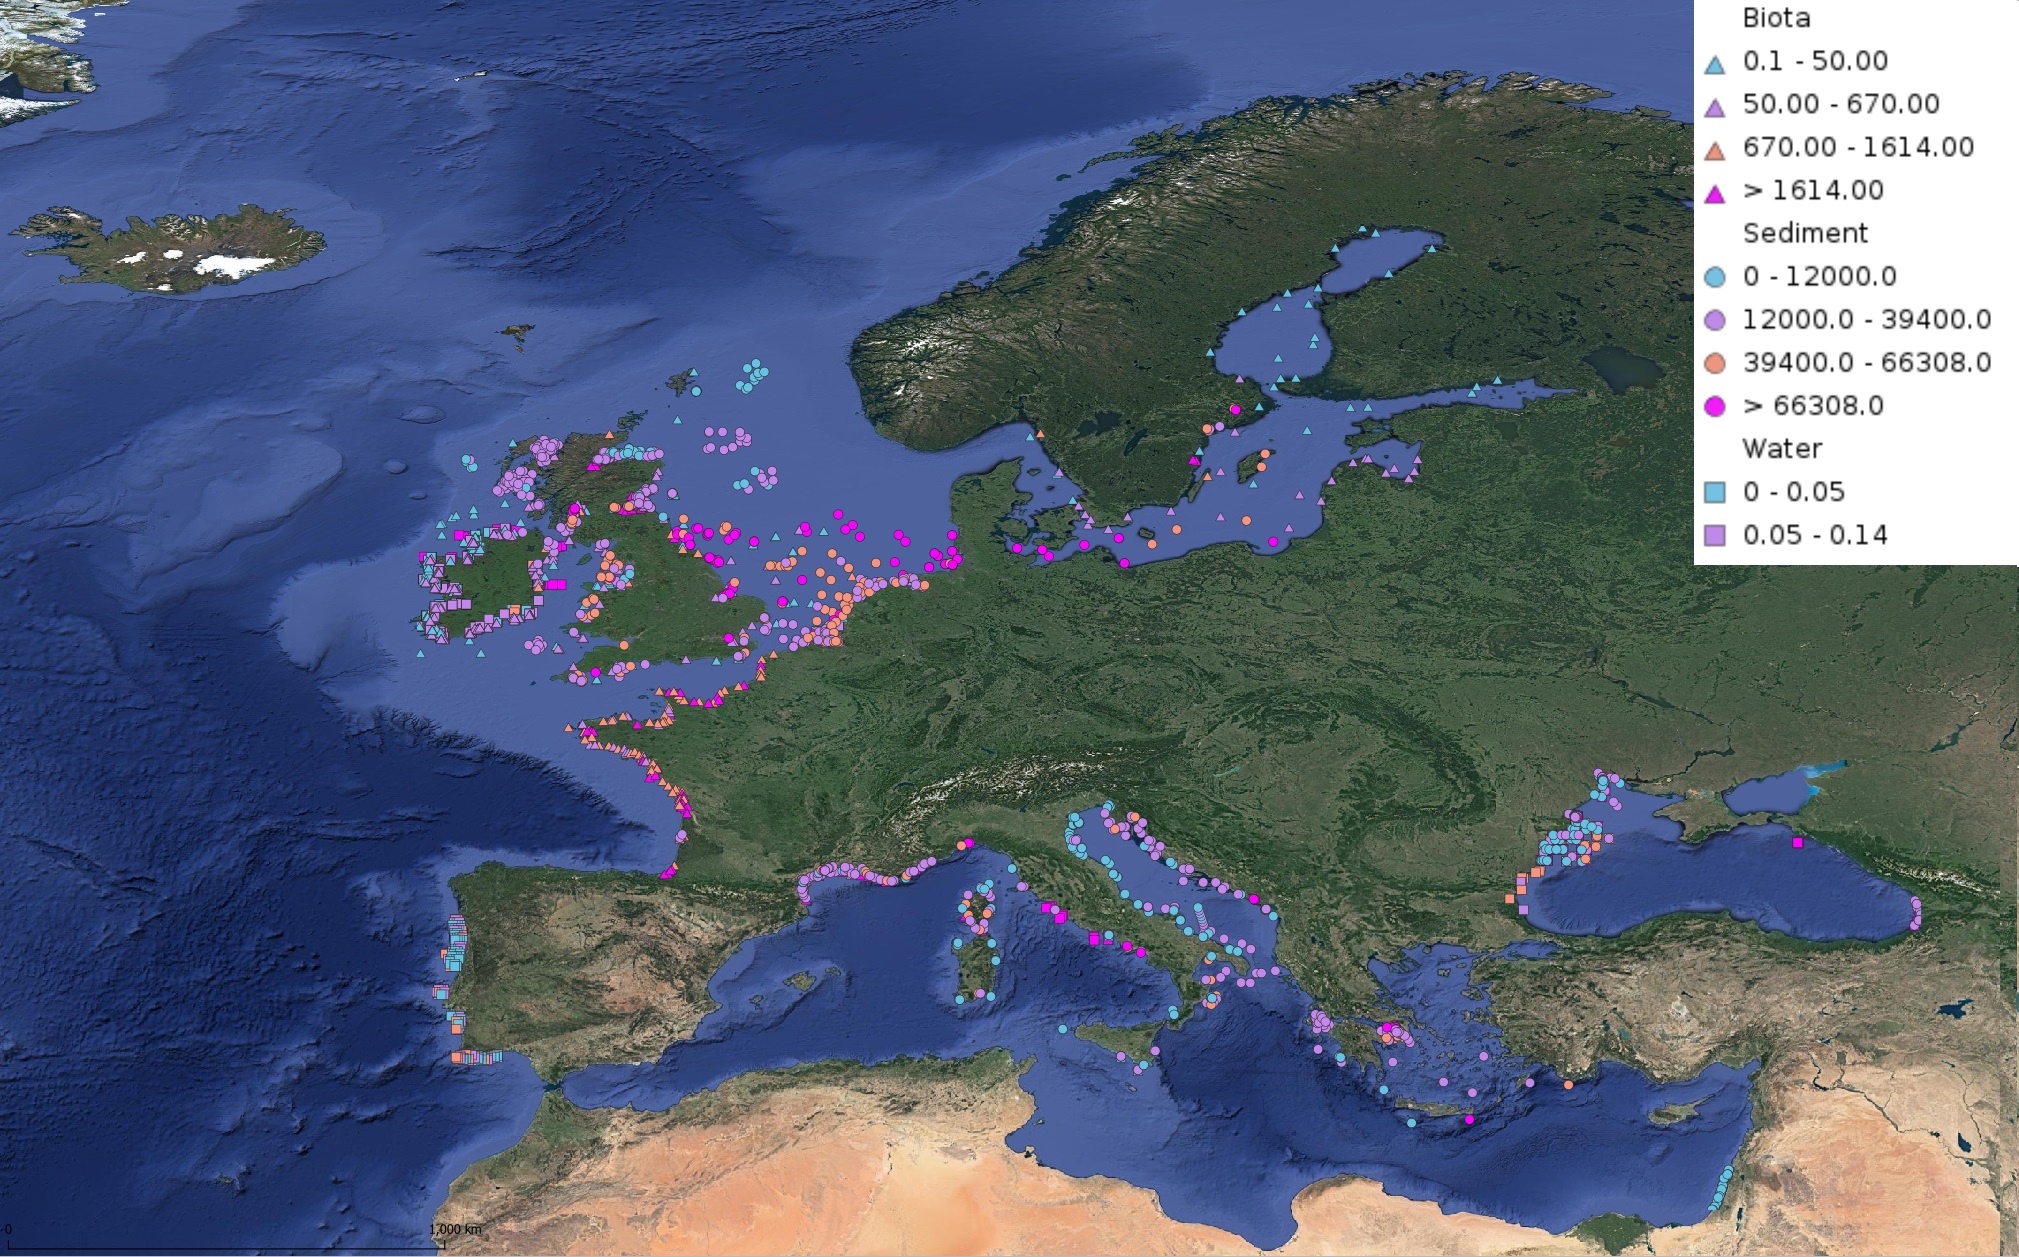
This product displays for Fluoranthene, median values of the last 6 available years that have been measured per matrix and are present in EMODnet validated datasets. The median values ranges are derived from the following percentiles: 0-25%, 25-75%, 75-90%, >90%. Only "good data" are used, namely data with Quality Flag=1, 2, 6, Q (SeaDataNet Quality Flag schema). For water, only surface values are used (0-15 m), for sediment and biota data at all depths are used.
-
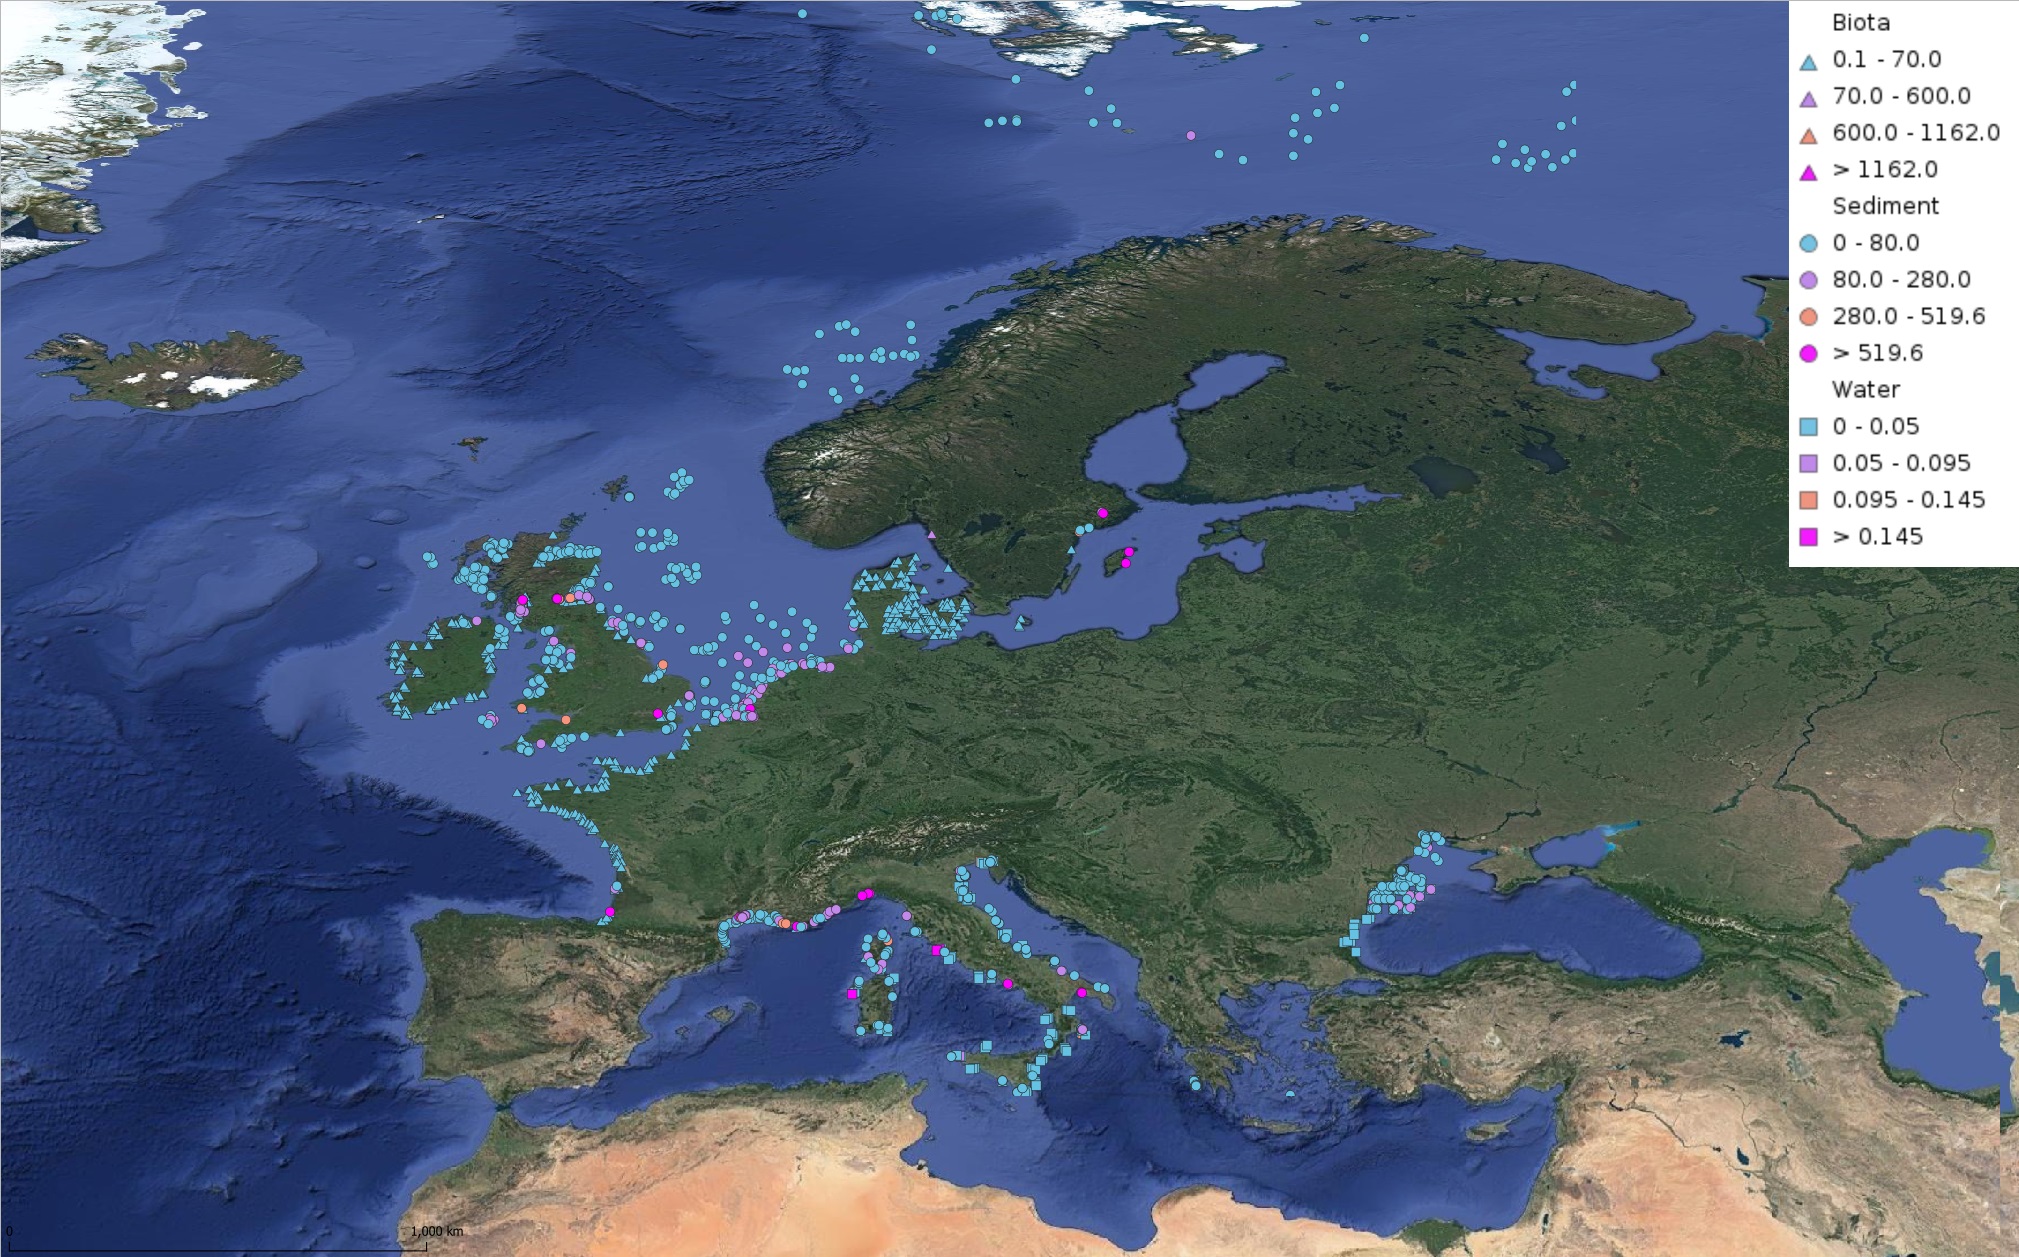
This product displays for Lead, median values of the last 6 available years that have been measured per matrix and are present in EMODnet validated datasets. The median values ranges are derived from the following percentiles: 0-25%, 25-75%, 75-90%, >90%. Only "good data" are used, namely data with Quality Flag=1, 2, 6, Q (SeaDataNet Quality Flag schema). For water, only surface values are used (0-15 m), for sediment and biota data at all depths are used.
-
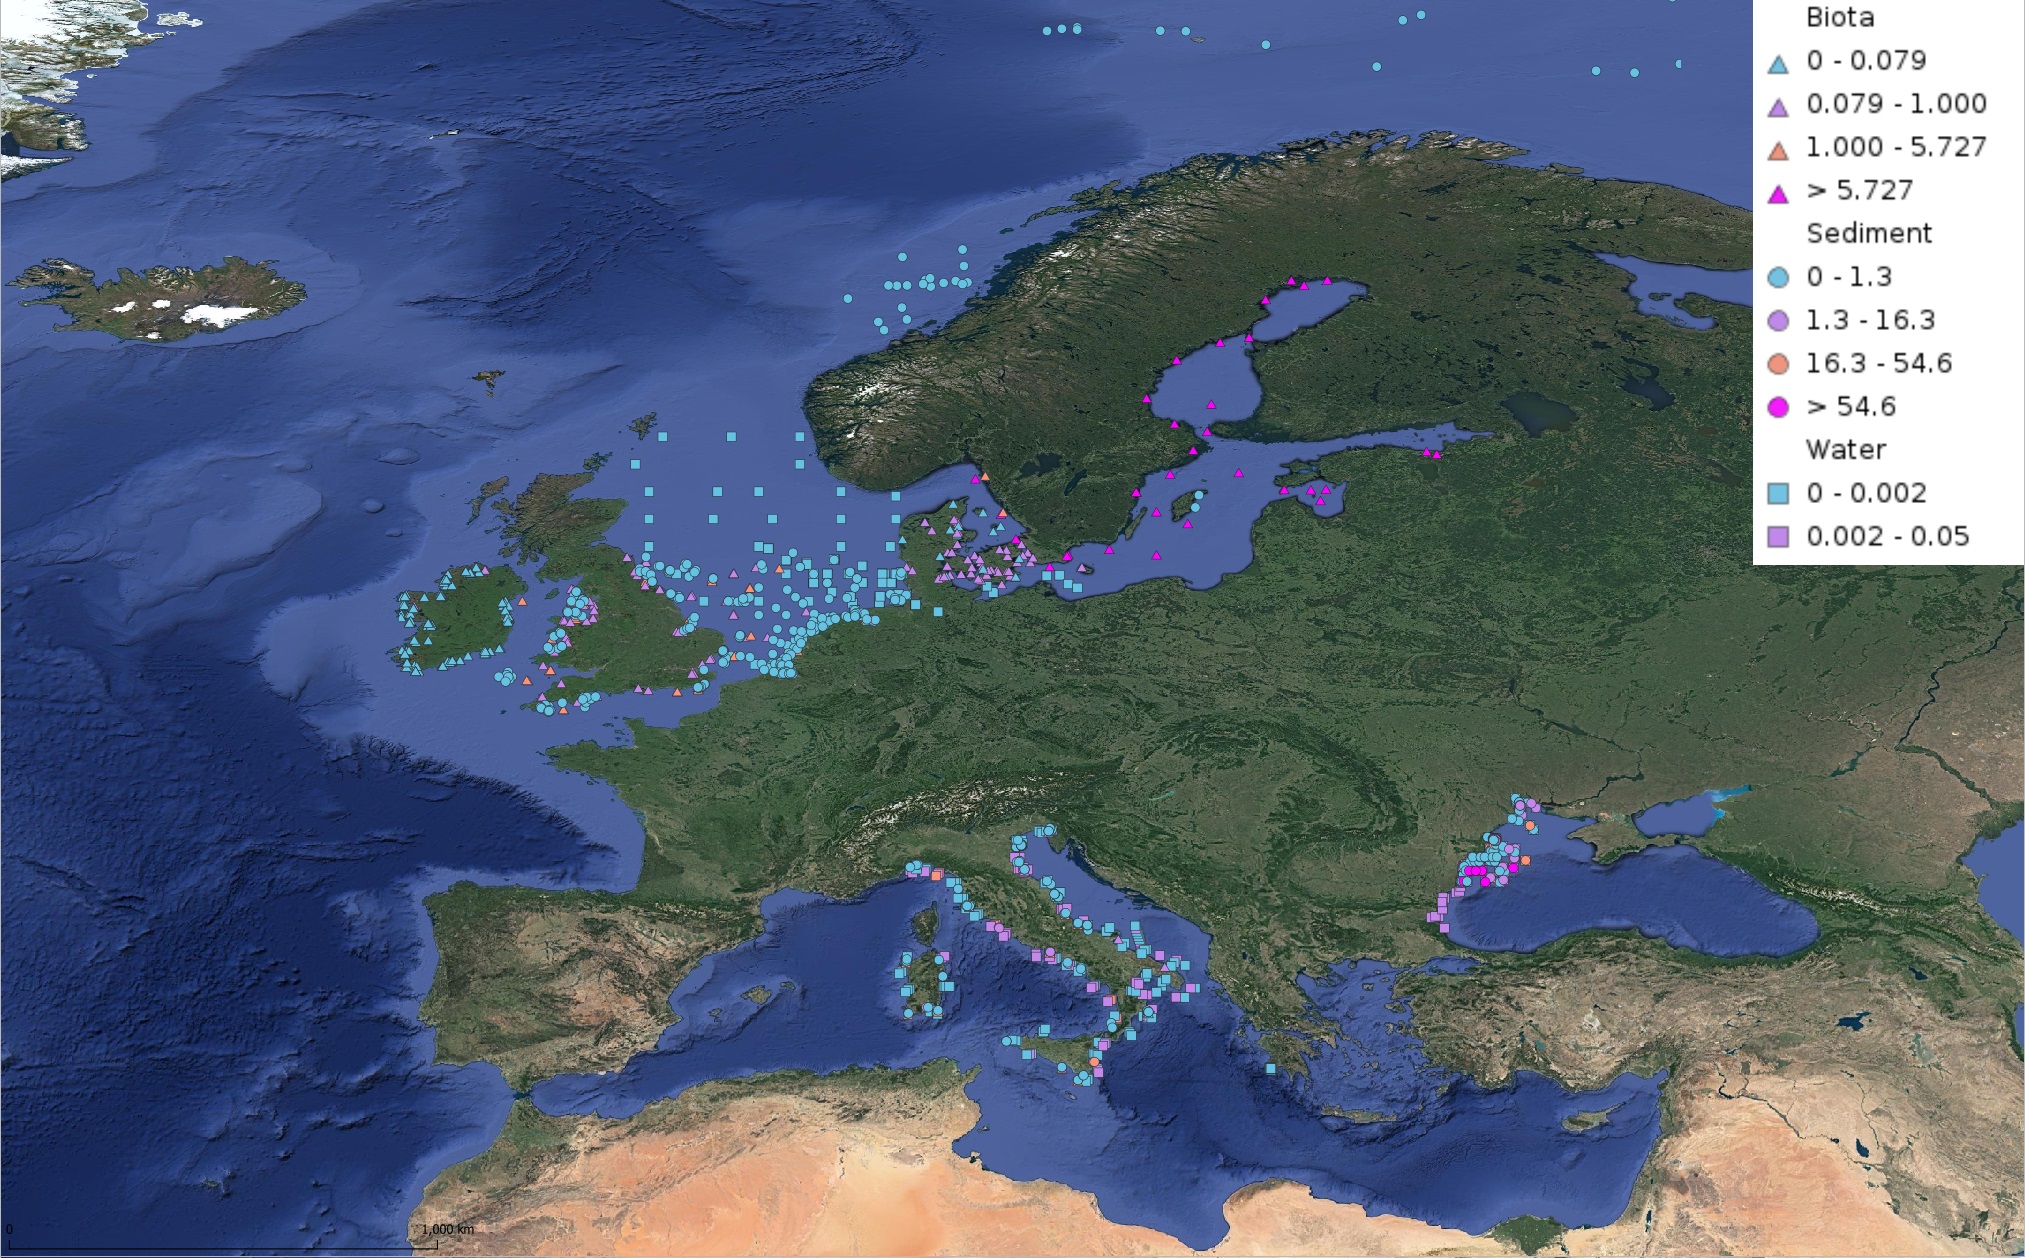
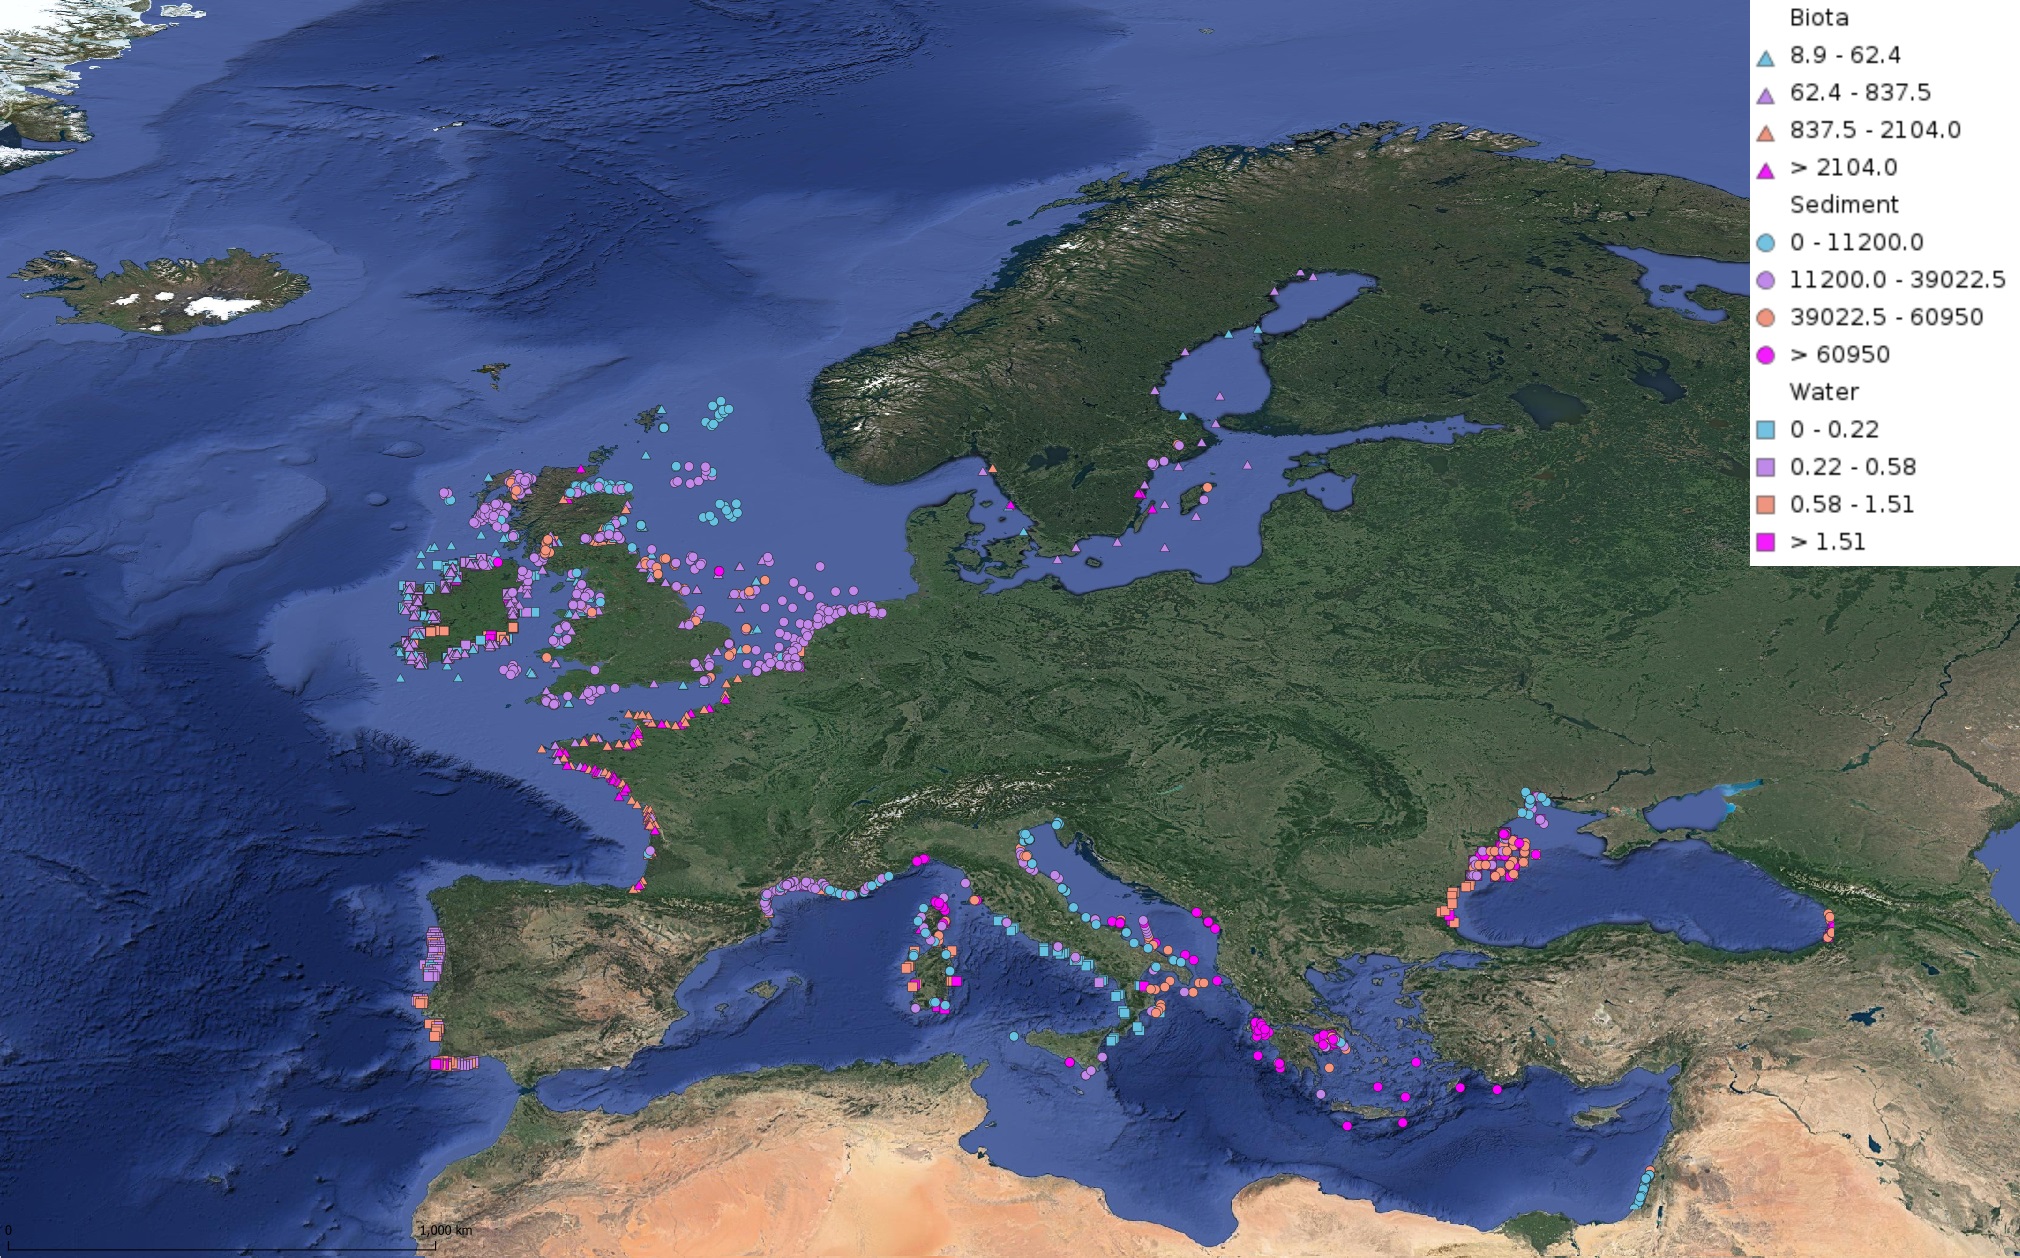
This product displays for Hexachlorobenzene, median values of the last 6 available years that have been measured per matrix and are present in EMODnet validated datasets. The median values ranges are derived from the following percentiles: 0-25%, 25-75%, 75-90%, >90%. Only "good data" are used, namely data with Quality Flag=1, 2, 6, Q (SeaDataNet Quality Flag schema). For water, only surface values are used (0-15 m), for sediment and biota data at all depths are used.
-
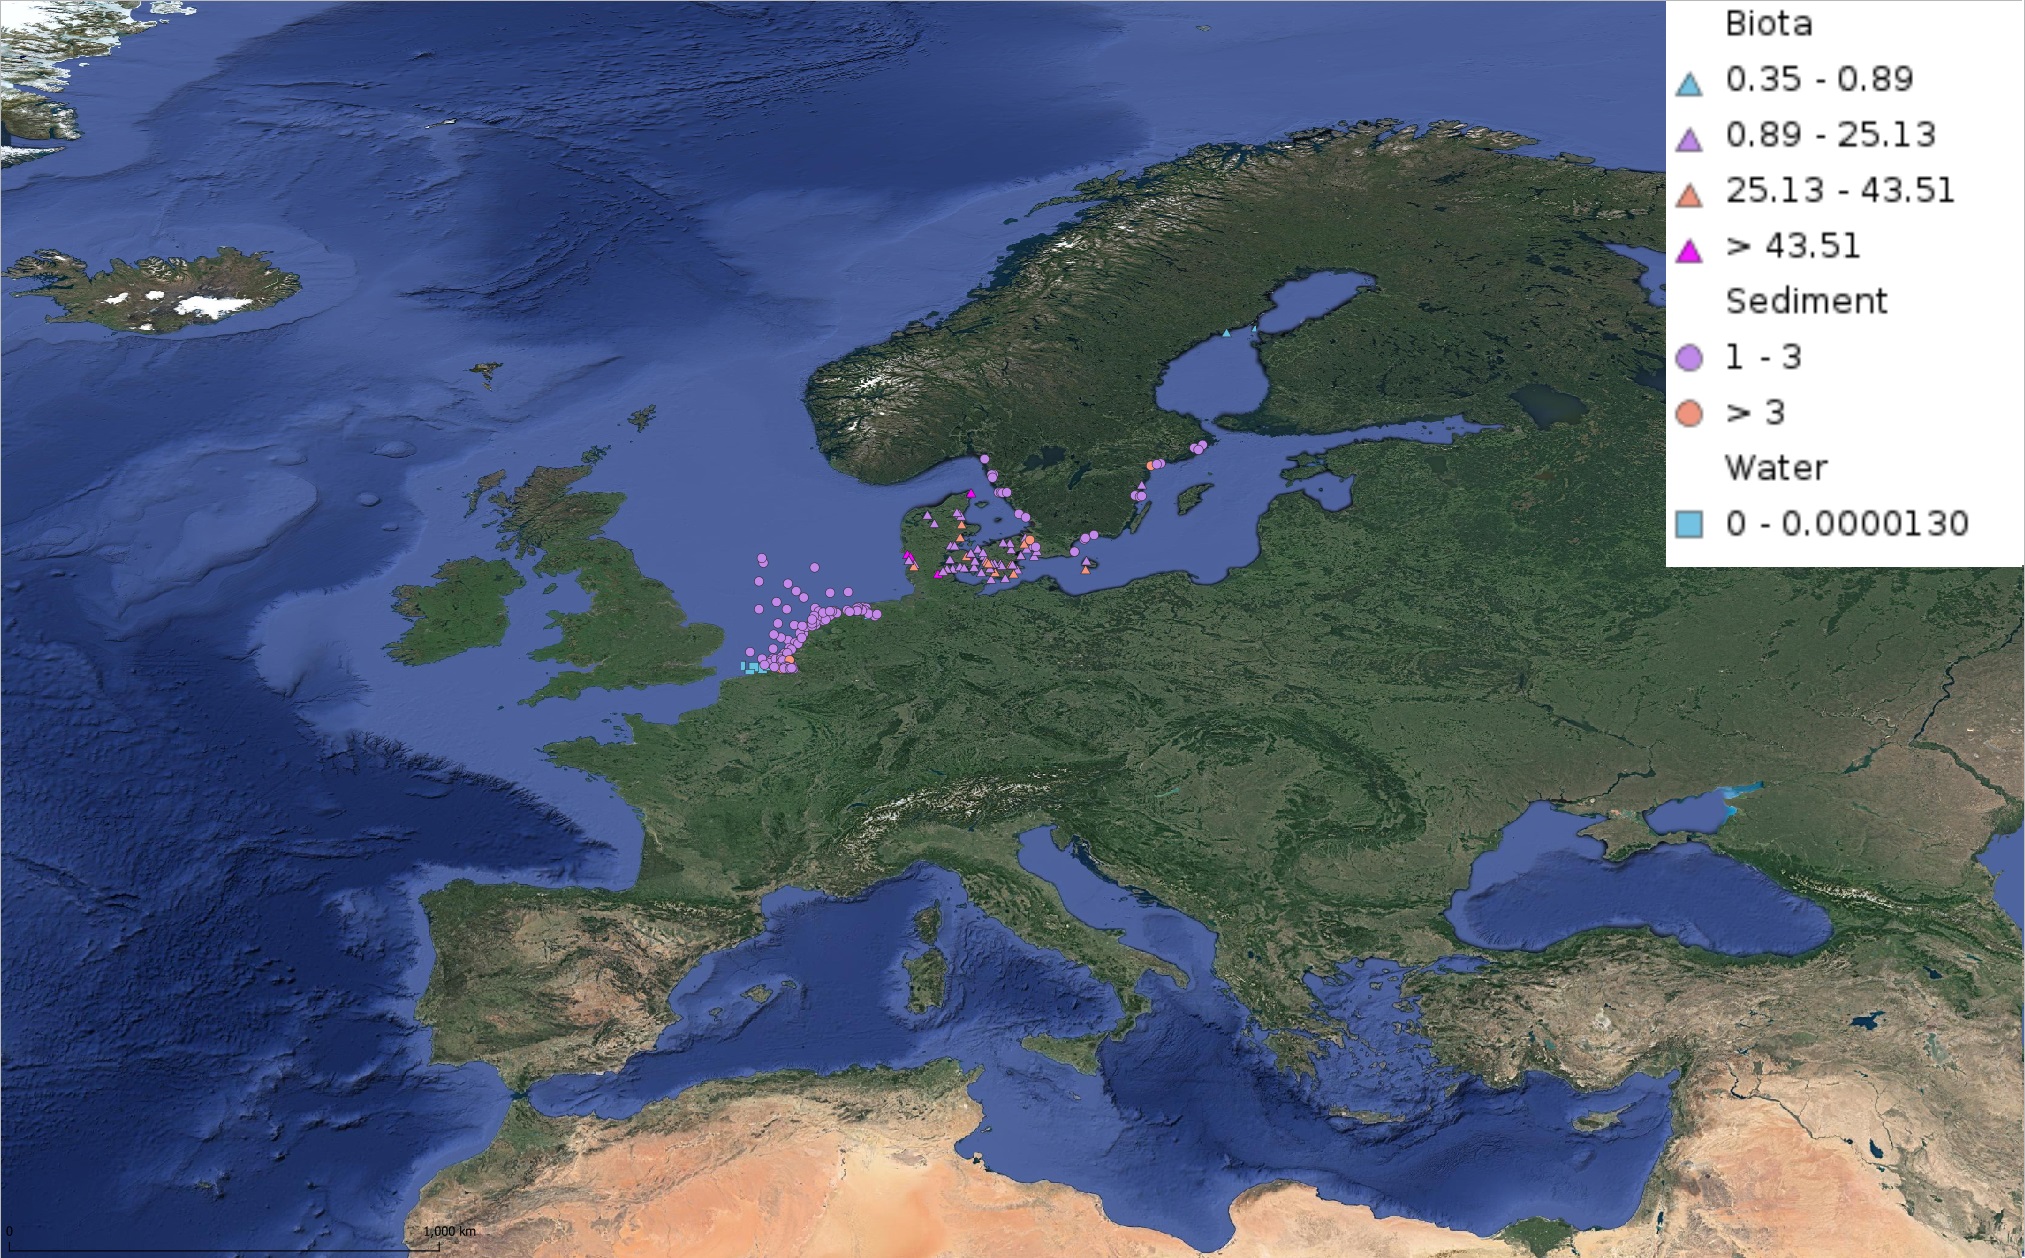
This product displays for Triphenyltin, median values of the last 6 available years that have been measured per matrix and are present in EMODnet validated datasets. The median values ranges are derived from the following percentiles: 0-25%, 25-75%, 75-90%, >90%. Only "good data" are used, namely data with Quality Flag=1, 2, 6, Q (SeaDataNet Quality Flag schema). For water, only surface values are used (0-15 m), for sediment and biota data at all depths are used.